

Abstract
Agricultural intensification and forest conservation are often seen as incompatible. Agricultural interventions can help boost food security for poor rural communities but in certain cases can exacerbate deforestation, known as the rebound effect. We tested whether coupling agricultural interventions with participatory forest zoning could improve food security and promote forest conservation in the Democratic Republic of the Congo. Simple agricultural interventions led to a >60% increase in cassava yields and a spill-over effect of improved cassava variety uptake in non-intervention zones. Household surveys conducted at the end of the 8 year project implementation period revealed that households that received agricultural interventions had more favorable attitudes toward forest zoning and conservation. The surveys also showed that farmers in the intervention domain practiced less land-intensive field and fallow management strategies compared to those practiced in the non-intervention domain. However, an 18 year time series analysis of Landsat satellite data revealed that agricultural expansion persisted in areas both with and without intervention assistance, and there is risk of a rebound effect. Approximately 70% of the tree cover loss that occurred outside of the agricultural areas was located within a 3 km buffer zone surrounding the outermost edges of the agricultural areas, which suggested that the majority of tree cover loss was caused by agricultural expansion. Within that 3 km buffer, average annual tree cover loss during the post-intervention period was higher in the intervention domain compared to the non-intervention domain (0.17% yr−1 compared to 0.11% yr−1 respectively, p < 0.001), suggesting risk of a rebound effect. The disconnection between household perceptions of zoning adherence and actual behavior indicates the importance of strengthening governance structures for community-based monitoring and enforcement.
Export citation and abstract BibTeX RIS

Original content from this work may be used under the terms of the Creative Commons Attribution 4.0 license. Any further distribution of this work must maintain attribution to the author(s) and the title of the work, journal citation and DOI.
1. Introduction
In the Democratic Republic of the Congo (DRC), which contains approximately 60% of Central Africa's lowland forests, poverty rates are among the highest in the world [1]. Agricultural activity and fuelwood collection are increasing as a result of growing human populations and comprise the majority of deforestation [2, 3]. This is predicted to rise as pressures to increase food production force smallholders to expand their agricultural areas into primary forests [4].
Africa's agricultural productivity on a per capita basis has fallen behind other parts of the developing world [5, 6] for a variety of reasons, including poor soil fertility and related nutrient deficiencies [7] and lack of access to modern agricultural technologies [8, 9]. Research has shown that to feed increasing populations and support sustainable rural livelihoods, agricultural productivity in Africa must be sustainably intensified, i.e. increase agricultural output per unit of area while minimizing environmental impact [6, 10, 11], especially in the light of Africa's projected fourfold population expansion expected by 2100 [12]. Promoting sustainable agricultural intensification strategies can help optimize the allocation of land for both conservation and food production [13–15]. However, intensification can spur increased deforestation caused by raising the profitability of agricultural production—known as the rebound effect [16, 17]—and can bring about other perverse market outcomes [18]. These negative outcomes can be lessened by implementing complementary land-use planning, governance and policy frameworks [19–21].
Achieving appropriate land use governance is a challenge where rural dwellers lack access to land tenure systems and are often marginalized in favor of private-sector natural resource extraction [22, 23]. Participatory mapping and planning processes can help achieve governance through community-based adoption of rules and enforcement of land use designations [24]. The DRC lacks a system of land tenure; legally, the country's forests and natural resources belong to the state. In 2002, however, the DRC adopted a Forest Code that allowed forest-dependent communities to formally request the right to manage their own forests [25]. The Ministerial Decree 14/018 (signed in 2014), which was then followed by the Ministerial Order 0/25 (adopted in 2016), completed the legal framework for communities to govern their own forest concessions up to a maximum of 50 000 hectares [26, 27]. DRC's rural villages, however, generally have very little capacity to initiate the mapping and legal recognition process required to obtain these management rights.
From 2009 until 2018, a consortium of institutions in partnership with the Government of DRC, has built capacity for community-based participatory forest zoning coupled with agricultural intensification interventions in Tshuapa Province, located in northern central DRC, an important habitat for the endangered bonobo (Pan paniscus) great ape. The consortium engaged 90 village communities (figure 1 and table S1 available online at stacks.iop.org/ERL/17/064002/mmedia) in voluntary participatory zoning and a subset received agricultural interventions to boost cassava production around a quid-pro-quo agreement [28, 29]. In this agreement, the subset of communities who received the agricultural interventions agreed to abide by commonly agreed land use designations that limited agricultural expansion to designated zones, and thus limited forest conversion outside these areas. A primary goal, alongside enhancing food production and protecting forests and their ecosystem services, was building local stakeholder capacity, empowerment, and ability to obtain formal government recognition of land management rights. Members of all 90 villages collaboratively defined, via a participatory mapping process, the geographic boundaries for the following land use zones: (a) agricultural micro-zones (AMZs), which contained the villages' agricultural activities, and (b) permanent forest micro-zones (PFZs), which were protected from agricultural expansion (figure 1).
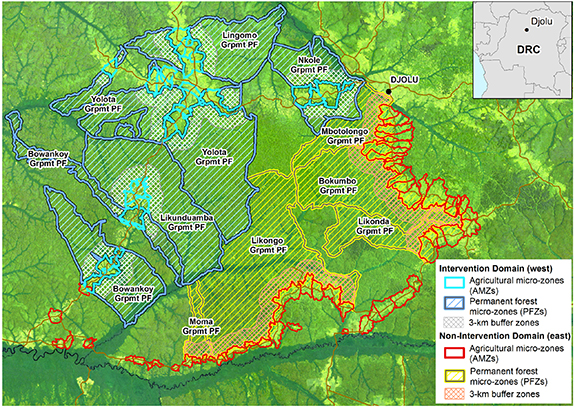
Figure 1. Study area. A satellite map of the study area with outlines delimiting the agricultural micro-zones (AMZs), permanent forest micro-zones (PFZs), and 3 km buffer zones color-coded by those belonging to the intervention domain (western part of map) and the non-intervention domain (eastern part of the map). The PFZs are labeled by administrative Groupement.
Download figure:
Standard image High-resolution imageFor this study, we assessed household perceptions of the zoning process, assessed farmers' decisions related to field and fallow management, and estimated the uptake rates of improved cassava varieties and assessed yields of improved versus local cassava varieties. Subsequently, we analyzed and compared changes in annual rates of observed tree cover loss in the forest zones between project intervention and pre-intervention time periods. For each, we compared results between households that received the interventions with those that did not. We also conducted an accuracy assessment of our tree cover loss detections. Our research elucidates the importance of tropical forest monitoring, improves methods for monitoring human impacts on natural forests in areas where development initiatives are occurring, and helps inform policy debates centered around achieving forest conservation while increasing food productivity.
2. Methods
2.1. Study area
This study was conducted in a 2000 km2 area located in Tshuapa Province near the town of Djolu (figure 1). The area is part of the Maringa-Lopori-Wamba Landscape, which covers a 74 000 km2 area and extends through the three administrative provinces of Equateur, Mongala and Tshuapa. It was defined in 2002 by the Congo Basin Forest Partnership for the participative development and implementation of land-use management plans to promote conservation [30]. Although a well-established and active agricultural area historically, agricultural productivity is generally low. Challenges include widespread poverty, lack of government extension services, poor road infrastructure and poor waterway access to the main stem of the Congo River that limits farmers' access to markets. In addition, the area suffers from low seed quality, lack of seed diversity, depletion of soil nutrients and poor agronomic practices, such as low planting density and limited weeding.
Cassava is the most important staple crop of this area and provides the majority of daily calories. Current cassava yields, however, are well below their potential and the cassava value chain is not well developed. Agricultural practices are based on shifting cultivation, relying on slash and burn, crop rotation and fallow methods (i.e. abandoning fields after harvest to regrow as forest for a specified number of years in order to re-establish soil fertility). Pressure to increase food production forces smallholders to expand their agricultural activities into primary forests and/or shorten fallows below a level necessary to maintain sustainability, and this is confirmed by results of recent analyses of spatial data in the DRC [3, 4]. In areas where fallow times have been cut short, crop productivity will decline in the absence of input substitution, making this an unsustainable practice.
2.2. Participatory forest zoning and agricultural interventions
Participatory forest zoning activities were conducted with 90 villages in the study area that belong to 13 administrative Groupements (figure 1). Each village mapped collaboratively the boundaries of two main types of forest usage zones: (a) agricultural micro-zones (AMZs), which contain the villages' agricultural activities, and (b) permanent forest micro-zones (PFZs), which are protected from agricultural expansion. Using a Geographic Information System (GIS), we also delineated (c) a buffer zone located within the PFZs that extended 3 km away from the outermost boundary of the AMZ. Since tree cover loss in this area is all caused by agricultural expansion and its geographic pattern generally extends outward from the roads and agricultural areas [3, 31], such a buffer zone might be required to manage agricultural activities that expand outside of the AMZs and could be appropriate for implementing less intensively extractive practices to support local livelihoods, such as agro-forestry.
A total of 30 villages belonging to the 'intervention domain' (table S1) voluntarily signed a Memorandum of Understanding (MOU); this forms the basis of the quid-pro-quo agreements. The villages belong to five administrative Groupements and began mapping the boundaries of their micro-zones in 2010. More detail is provided in the supplementary materials.
Agricultural intervention support was offered in two forms. The first was through the dissemination of eight improved cassava varieties. The second form of intervention provided hands-on farmer trainings to members of farmers' cooperatives. More detail is provided in the supplementary materials.
The remaining 57 other villages, belonging to the 'non-intervention domain' (table S1), did not receive agricultural intervention support and therefore did not sign the MOU mentioned above. These villages, which belong to eight administrative Groupements, collaboratively mapped the boundaries of their AMZs starting in 2014.
Locations of the villages were clustered by domain but geographically split as shown in figure 1. This is because the interventions were first implemented with the villages located along the western road axes of the study area and limited funding resources prevented the project from being able to extend the same intervention support to the remaining villages located along the eastern and southern road axes.
2.3. Household surveys: micro-zoning perceptions and field and fallow management
Between December 2016 and January 2017, we deployed structured household questionnaires to 371 households in 83 of the villages across the 13 Groupements in the study area to understand both local perceptions of the micro-zoning process and field and fallow management across the intervention and non-intervention domains. The questionnaires were deployed using a stratified sampling methodology using the two domains of intervention vs. non-intervention villages. In total, we interviewed 209 households in the intervention domain and 162 households in the non-intervention domain. More detail on the sampling methodology, questionnaire content, and data analysis is provided in the supplementary materials.
2.4. Field study: in-situ cassava yields
We collected data on cassava yields and cultivation practices across the intervention villages to determine (a) village uptake of the improved cassava and (b) productivity of the improved cassava. These methods are described in more detail in the supplementary materials.
2.5. Tree cover loss analysis
2.5.1. Landsat time-series tree cover mapping
We analyzed 19 years (2000–2018) of Landsat satellite imagery available from the United States Geological Survey National Center for Earth Resources Observation and Science. Landsat images were processed using an automated method developed by [32] into a spatially and temporally consistent time-series dataset that served as input to the annual change detection model. We then mapped annual forest change as described in the supplementary materials.
2.5.2. Calculation of primary forest and tree cover loss statistics
We conducted three types of tree cover analyses. First, we tested whether the proportion of primary forest within each zone type in 2001 was different between domains using data from [33] in order to elucidate if baseline forest conditions were consistent throughout the study area prior to the intervention periods and whether the non-random (and geographically clustered) distribution of the domains (figure 1) contributed any bias to our study. For this, we calculated the surface area of each zone and the surface area of primary forest within each zone, sub-divided by domain and then calculated the proportion of primary forest within each. Second, we masked out any areas inside the 3 km buffer zones and PFZs that were not mapped as primary forest in 2001 by [33]. Third, we spatially subtracted each 3 km buffer zone from each corresponding PFZ so that each PFZ boundary excluded the 3 km buffer zone. We then calculated the annualized area of tree cover loss that occurred from 2001 until 2018 as a percentage of the total area of the following two zone types: (a) 3 km buffer zone and (b) the PFZ excluding the 3 km buffer zone.
We compared the amount of tree cover loss that occurred in each zone between pre- and post-intervention time periods for each of the intervention and non-intervention domains. We categorized the following time periods as follows: from 2001 to 2010 (10 years) was the pre-intervention period, from 2011 to 2012 was the start of implementation when the forest zoning mapping was conducted and agricultural interventions began, and from 2013 to 2018 (6 years) was the post-intervention period when we measured results.
We implemented stratified random sampling for assessing forest loss map accuracy [34], as described in the supplementary materials.
3. Results
3.1. Forest zoning perceptions
Although all household survey respondents belonged to villages that had undergone the forest zoning process, household awareness varied between domains. For households that received the agricultural interventions (hereby called those in the 'intervention domain'), 80 ± 3% (hereby defined as the mean ± standard error of mean) of the respondents had heard of the zoning process, while for those in the non-intervention domain, only 53 ± 5% had heard of it (figure 2(a)). Additionally, household participation in the zoning process varied between domains: 59 ± 3% of the households participated in the intervention domain, while only 38 ± 6% participated in the non-intervention domain (figure 2(b)). Furthermore, a higher proportion of respondents in the intervention domain (55 ± 3%) knew the location of the AMZ boundaries compared to the non-intervention domain (37 ± 4%) (figure 2(c)). Finally, about half of the households in the intervention villages (50 ± 3%) thought that the AMZ limits were respected in their village, whereas only 24 ± 4% thought so in the non-intervention villages (figure 2(d)).
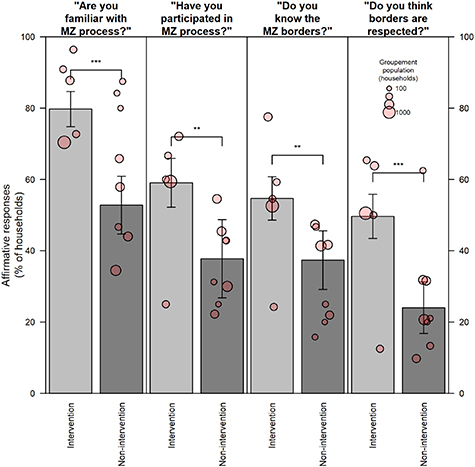
Figure 2. Household perceptions of the micro-zoning process. Household perceptions of the micro-zoning process for the 13 administrative Groupements. Proportion of households that have heard of the micro-zoning process (a). Proportion of households that participated in the micro-zoning process (b). Proportion of households that knew the location of the micro-zoning boundaries (c). Proportion of the total population that thought the micro-zoning boundaries were respected (d). The number of red circles is the number of administrative Groupements per zone. The size of the circle indicates the total population of households by Groupement. Whiskers indicate the 95% confidence interval. Significances of a design-based two sample t-test are shown as: '***' (p < 0.001), '**' (p < 0.01), '*' (p < 0.05), '.' (p < 0.1) and 'NS' (p > 0.1).
Download figure:
Standard image High-resolution image3.2. Cassava improved varietal uptake and yield
Household uptake of improved cassava varieties differed between domains. In the intervention domain, 72.4 ± 2.7% (1796 ± 66 households) reported using improved varieties, while in the non-intervention domain only 13.9 ± 3.0% (416 ± 90 households) reported using them (figure 3).
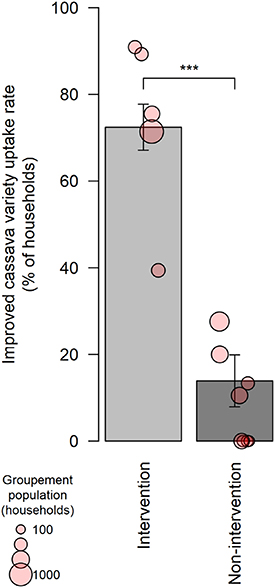
Figure 3. Improved varieties of cassava. The proportion of households growing improved varieties of cassava. The number of red circles is the number of administrative Groupements per zone. The size of the circle indicates the total population of households by Groupement. Whiskers indicate the 95% confidence interval. Significances of a design-based two sample t-test are shown as: '***' (p < 0.001), '**' (p < 0.01), '*' (p < 0.05), '.' (p < 0.1) and 'NS' (p > 0.1).
Download figure:
Standard image High-resolution imageOn average, improved varieties yielded 62% more than the local varieties (24.5 ± 1.5 Mg ha−1 and 15.1 ± 1.1 Mg ha−1, respectively, significant to p < 0.001) (figure 4). Assessment of yields for the eight improved cassava varieties showed that varieties Obama and Ilona had on average both the highest total yield (33.4 and 33.9 Mg ha−1, respectively) and highest marketable yield (27.5 and 24.6 Mg ha−1, respectively), although they were not frequently encountered (table S2). From the local varieties, Mbandaka and Isakakala were the most productive, with total yields of 19.0 and 21.5 Mg ha−1 respectively, and with marketable yields of 13.8 and 13.4 Mg ha−1 respectively. The share of marketable tubers in the total yield was strongly variety-dependent and ranged between 52% (Vuvu) and 87% (Mayombe). There was limited evidence for a difference in the share of marketable yield between local and improved varieties (69% for local compared to 73% for improved varieties, p < 0.05, two-sample t-test).
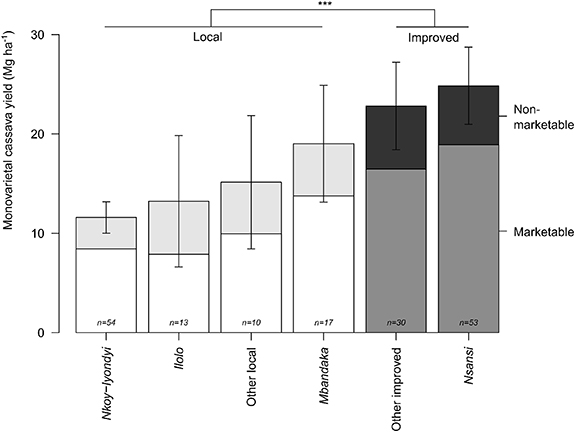
Figure 4. Cassava yields. Assessment of yields for six local and nine improved cassava varieties. Lesser abundant varieties are grouped into 'other local' (Isakakala, Makusele, Nkoy Esongo) and 'other improved' (Butamu, Dinsanka, Ilona, Kansakaku, Mayombe, Obama, Vuvu, Zizila) with n the number of circular sampling plots where destructive yield measurements took place. The total cassava tuber yield is split into marketable and non-marketable yields. Whiskers indicate the 95% confidence interval on the total yield. Results of a two-sample t-test indicate a lower mean yield for local varieties (*** p < 0.001).
Download figure:
Standard image High-resolution image3.3. Field and fallow management
Households in the intervention domain had lower number of actively farmed fields (2.1 vs. 2.3) and more fallows (7.7 vs. 5.1) than households in the non-intervention domain (figures S1(a) and (b)). Approximately 70% of intervention and 55% of non-intervention households reported they had not cleared primary forest for agricultural purposes since 2010 (figure S2). The approximate walking time from the house to the nearest field was on average 22.0 ± 1.3 min in the intervention domain and 29 ± 2 in the non-intervention domain (figure S3(a)). However, there were large differences between administrative Groupements, and broad confidence levels indicated that substantial variation existed within each individual Groupement. The approximate walking time from the house to the furthest field was on average 42 ± 2 min in the intervention domain and 51 ± 3 min in the non-intervention domain (figure S3(b)). Households belonging to the intervention domain walked shorter distances to reach their closest fallowed field compared to households belonging to the non-intervention domain (14 ± 1 compared to 19 ± 1 min) (figure S3(c)). There was not a significant difference between domains in walking time to the furthest fallowed field (figure S3(d)). In the intervention domain, 89 ± 12% of the households reported that they thought they had sufficient fields and fallows to satisfy their anticipated needs over the next 5–10 years; this was only 59 ± 4% in the non-intervention domain (figure S4).
3.4. Tree cover loss
3.4.1. Primary forest analysis (2001)
The percentage of land covered by primary forest in all three zones in year 2001 was similar between the intervention and non-intervention domains, which proved consistency in their forest land cover prior to the study (table S3).
3.4.2. Tree cover loss mapping by forest zone
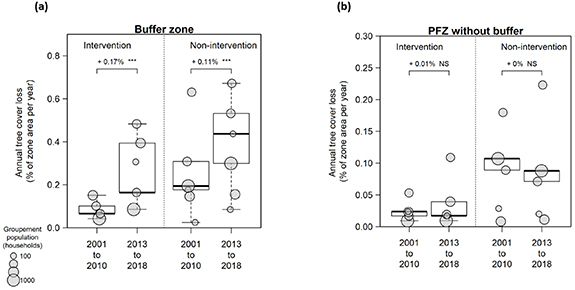
Approximately 70% of the tree cover loss that took place in the PFZs from 2001 to 2018 occurred within the 3 km buffer zone, which suggests that the loss is driven by agricultural expansion. In the buffer zone, average annual tree cover loss between pre- and post-intervention periods increased by 0.17% yr−1 (from 0.08% yr−1 to 0.25% yr−1) in the intervention domain compared to 0.11% yr−1 (from 0.29% yr−1 to 0.41% yr−1) in the non-intervention domain (figure 5(a)). Inside the PFZs, average annual tree cover loss between time periods was not statistically different for either domain but increased by 0.01% yr−1 (from 0.024% yr−1 to 0.031% yr−1) in the intervention domain and remained unchanged in the non-intervention domain (figure 5(b)). Annual tree cover loss across the 18 year period was higher overall in the non-intervention domain for both the buffer zones and the PFZs (figures S5(a) and (b)). However, between 2016 and 2018, tree cover loss inside the buffer zone in the intervention domain escalated to match and even surpass that of the non-intervention domain (figure S5(a)). Meanwhile, annual tree cover loss inside the PFZs remained relatively parallel between domains, with more yearly variation appearing in the non-intervention domain (figure S5(b)). Tree cover loss decreased for both domains in each zone during the intervention period between 2010 and 2013, and more steeply decreased for the non-intervention domain in both zones (figures S5(a) and (b)).
Figure 5. Annual tree cover loss. Annual tree cover loss (% of zone area per year) in pre-intervention (2001–2010) and post-intervention (2013–2018) time periods for the 3 km buffer zone (a) and the PFZ excluding the buffer zone (b). The change (%) and significance in tree forest loss between each time period is shown near the top of each graph. Weighted significances of a bootstrapped t-test are shown as: '***' (p < 0.001), '**' (p < 0.01), '*' (p < 0.05), '.' (p < 0.1) and 'NS' (p > 0.1).
Download figure:
Standard image High-resolution image
A sample-based validation confirmed a high level of accuracy for the forest cover loss map. The overall accuracies of both 2001–2010 and 2013–2018 forest cover loss maps were 99.9%. Other accuracy metrics were likewise comparable between the time intervals (table S4).
4. Discussion
With growing populations dependent on farming as a major source of employment and livelihoods, Africa is faced with a critical socio-ecological challenge: boost food security while conserving the rich biological integrity of its forests and ecosystems [14]. Although environmental trade-offs will be necessary to raise global food production [35], research suggests that negative environmental impacts can be lessened by achieving higher yields on existing croplands in under-yielding countries [15, 36]. However, there is conflicting and sparse evidence about the extent to which agricultural intensification can conserve natural lands in Central and Sub-Saharan Africa. Importantly, there is now greater recognition that intensification of commodity crops (as opposed to staple caloric crops consumed by food insecure households that is the focus of this study) is more likely to result in the rebound effect that can exacerbate deforestation [35]. Other research stresses the importance of complementary participatory land use zoning to reduce deforestation [37, 38].
Here, we investigated whether a quid-pro-quo approach resulted in positive socio-ecological outcomes. Results revealed potential shifts in social norms and perceptions that signaled positive support for forest zoning. Households belonging to the intervention domain had enhanced awareness of, and more positive attitudes about, the land sparing and forest zoning concepts, which indicated that the intervention households would be more likely to adhere to zoning rules governing agricultural expansion. There is therefore potential in this region to engage in participatory forest zoning processes that encourage more sustainable management of land and resources through direct participation of local communities through these types of agreements. The interventions produced clear gains in cassava yields; furthermore, around 75% of households in the intervention domain and 14% of households in the non-intervention domain cultivated improved varieties of cassava, which indicates a potential spill-over effect from the interventions. This demonstrates significant potential to increase food productivity through uptake of improved cassava varieties in this region. However, sustaining increased yields and income in the longer term will require additional interventions for greater market development, which could in turn negatively affect forest conservation [39].
Although the household surveys showed support for positive conservation outcomes from the agricultural interventions, the results of the satellite-based analysis did not. Tree cover loss continued to increase during the post-intervention period for both domains in both the buffer zones and the PFZs, and no real effect of the interventions on forest conservation was detected. In fact, the escalation of tree cover loss inside the buffer zone of the intervention domain during the post-intervention period signals risk for a rebound effect. The disconnection between household perceptions of zoning adherence and actual behavior warrants discussion. First, there is a risk of bias known as social desirability bias when conducting surveys with beneficiaries of interventions, since these beneficiaries could respond in ways that seek to minimize self-stigmatization and generate a more positive image [40], especially when interviews are conducted by project staff. Second, although natural resource management interventions can result in increased positive conservation outcomes [41, 42], these types of interventions can be less effective when presented to landholders who are dependent on clearing land to maximize livelihood gains [43]. Interventions that aim to generate income via alternative livelihoods that do not require deforestation such as beekeeping, soap-making, tailoring and food processing might therefore have greater potential of conserving forest in the study area.
Our results emphasize the importance of strengthening the formalization of land rights and governance structures for community-based monitoring and enforcement. Coupled with agricultural interventions, participatory adoption of rules and enforcement of land use designations as part of a formal zoning process is crucial to ensure that the PFZ areas are maintained long-term [20]. Formalization of land tenure and strengthened land management rights can lead to positive outcomes for human socio-economic well-being, women's empowerment, food security, and forest conservation [44–47]. However, because communities may be managing lands in order to maximize livelihood gains, it is important that arrangements like the quid-pro-quo agreements used in this study provide clear incentives for communities to actively conserve their forested land [45].
Because 70% of tree cover loss in the PFZs occurred inside the 3 km buffer zone, pressure on the PFZs is most likely exerted by direct agricultural expansion from the AMZs. Households in the non-intervention domain reported walking longer durations to access both their furthest fields and their nearest fallows, which indicates that they were farming geographically farther from their homesteads and extending potentially into the buffer zones and/or PFZs. This presents important social implications beyond deforestation, especially for women, who have important roles in farming and harvesting crops in the DRC and who face increased safety risks when required to travel farther from their homes to cultivate land [48]. A previous study in the same area [28] found that villages that supported higher human populations had generally larger AMZ surface areas; therefore, human population size was likely not the main driver of a village's decision to expand its agricultural activities into the PFZ. There is therefore theoretical support that agricultural interventions aimed at boosting production have potential to decrease agricultural expansion into the PFZs.
In addition, the satellite analysis of tree cover loss presented two notable caveats that illustrate technical complexities of effective monitoring of the interventions based on satellite analysis alone. One caveat was related to the timing of our monitoring efforts, which was limited to a 5 year post-intervention period. Although we do not have evidence from the literature that a 5 year post-intervention period is insufficient, it is likely a minimal timeframe to comprehensively monitor change [44]. The timing of the study's interventions also presented some challenges for accurate monitoring. Non-intervention villages began their sensitization and formal participatory zoning activities in early 2014, which marked the second year of the post-implementation period for the intervention domain. Therefore, some land use decisions made by the non-intervention domain beginning in 2014 might reflect the community sensitization and forest zoning activities that co-occurred around that time.
A second caveat was related to satellite data quality and availability. The Landsat data archive grew enormously in 2013 with the launch of Landsat 8. A higher Landsat observation frequency is reflected by the difference between the user's and producer's accuracies of the forest loss class (table S4). Specifically, the higher producer's accuracy of 97.5 for the 2013–2018 period compared to 95.6 for the 2001–2010 period indicates slightly higher sensitivity of the change detection model to forest loss after the year 2013. Nevertheless, the differences in map accuracies were very small and were not reflected in the overall accuracies, which suggests that the forest loss results for both time intervals can be directly compared.
We did not find a reason for bias contributed by the non-random distribution of intervention and non-intervention village domains. Although we were only able to test for similarity in the proportion of primary forest land cover between domains for each zone type prior to the study, we believe that other characteristics of the study area likely enabled a somewhat consistent comparison between domains. For example, the villages located in both domains were similar in their remoteness and farther proximity to the region's larger market hubs of Kisangani and Boende; the only roads connecting them to these areas are unpaved, dirt tracks that connect the villages. In fact, the clustered distribution of villages in the two domains likely enabled a more spatially consistent interpretation of deforestation; we believe that it might have potentially been more difficult to attribute deforestation to a single village in one domain if the surrounding villages belonged to the opposite domain, where the potential for spillover effects could be quite high.
However, we note other limitations to our study. While conducting the household surveys, we were unable to interview as many households in the non-intervention domain as in the intervention domain due to non-responsiveness. In addition, a variety of other factors that were not accounted for in our study could play a significant role in the motivation and ability of farmers to adopt new techniques and/or self-limit their agricultural expansion. These factors might include measures of market access, off-farm income activities like the collection and sale of non-timber forest products, labor costs, land availability, and the quantity of agricultural products consumed versus sold [14]. Since we did not account for these factors, we cannot assume that our findings are transferrable to other geographical or socio-economic contexts outside our study site.
As increasing human populations exert pressure on Congo Basin forests, developing strategies that strengthen forest governance will be critical. Hence, voluntary agreements like the quid-pro-quo agreements used in this activity should strive to ensure that agricultural interventions are complemented by land management rights and rules that constrain the expansion of agricultural activity into nearby forests. Developing a more formal process for communities to manage their forest lands will encourage them to take ownership and responsibility for preserving the community forests that will extend beyond just a project-based approach [49]. These types of longer-term successes will be achieved best through education, active collaboration with local authorities and local and national institutions, and community empowerment through the direct participation of women, men and youth.
Acknowledgments
This research was made possible by the United States Agency for International Development (USAID) Central Africa Regional Program for the Environment (CARPE) Program (AID6660-A-13-00009 and NNX14AR46G). We would like to thank the Bill & Melinda Gates Foundation and USAID for cassava variety development. For assistance with the participatory micro-zoning delimitation, we would like to thank Zozime Esombo and Etienne Ingoli-Ingoli. For collection of household survey data, we would like to thank IITA's local facilitators and students from the local college, Institut Supérieur du Developpement Rural (ISDR-Djolu). The paper's lead author, Dr Janet Nackoney, was not working at USAID when the research for the current paper was conducted. The views and opinions expressed in this paper are those of the authors and not necessarily the views and opinions of the United States Agency for International Development.
Data availability statement
The data that support the findings of this study are available upon reasonable request from the authors.